10:47 PM
Insurance
In conditions of ever-changing business environment and level of competition in grabbing market share is more strict. Product marketing efforts is one key to the success of a business organization, including agribusiness. Marketing activities can be a source of corporate failures and / or become a waste if not properly planned. Many agribusiness entrepreneurs, especially the lower middle-scale often have difficulty in preparing a formal marketing program, so that the products are not able to reach the target market. Thus, the eighth edition of this Commodities Magazine, presented "Preparing A Marketing Plan Technique".
A marketing plan typically contains eight sections, namely: Executive Summary, Situation Analysis, SWOT Analysis and Problem Analysis; Target Marketing, Strategic Marketing; Programme of Action; Profit Loss Projection;, and Control (Kotler, 1994). Each section will be outlined below.
1. The executive summary is an overview of the entire marketing plan that has been
made, so that it can provide a picture of the things the main contents of a
marketing plan.
2. Provide data and information regarding the marketing situation, including:
a. Market Situation.
Data and information regarding the large and growing market for several years
and the trend in the next few years, and the trend to change perception and
consumer behavior.
b. Products Situation.
Data sales growth, price level, the contribution margin, and profitability.
c. Competition Situation.
Data concerning competitors, capacity of, market share, objectives and
strategies, product quality, and various characteristics of the relevant
competitors.
d. Distribution Situation.
Type, quantity, territory and the role of distribution channels (eg, sources
of information, means of promotion, trying to add a buyer, make adjustments,
to negotiate the price and method of payment, physical distribution, financing
the distribution, and / or share in the Macro Environment risk. Situation
demographic environment, economic, social, cultural, political, legal,
defense, and technology.
3. SWOT Analysis and Problem Analysis. Identifying and analyzing the opportunities
and threats facing the company as a result intraksi external environment that may
affect company performance. Influence of the internal environment intraksi
companies also need to be identified and analyzed the strengths and weaknesses.
Thus, after a SWOT analysis done formulated the principal issues that must be
relied upon in determining the objectives, strategies and action plans / tactics.
4. Target. Defining the target (goal) is to be achieved, both financial goals and
target marketing. Financial goals such as ROI, cash flow and profits. Goals
include a target marketing and sales growth, market share, market coverage, the
number of
distribution channels, price level, etc.
5. Marketing Strategy. The marketing strategy was formulated based on the SWOT and
targets to be achieved, and stipulating primarily based on consideration of costs
and benefits, as well as resource capacity to implement them. Sample statement of
local marketing strategy ketchup brand X (hypothetical) described below.
Target market: the lower middle class.
a. Placement: soy products rich in protein, delicious and cheap
b. Product lines: To diversify the brand and packaging to distinguish
middle-class market segment and lower classes and with different prices.
c. Price: A little lower than competitors' prices
d. Distribution channels: Concentrate on the stalls, wholesalers, and stall baso,
and noodle stew.
e. Salesperson: Increase the number and improve the ability of salespeople as
well as providing a good incentive.
f. Services: Product is easy and inexpensive to obtain.
g. Promotion: Increase the budget for printing promotional leaflets / banners
will be placed in the stalls, as well as for gifts.
h. R & D: Raise a budget of 10% to improve the design of the packaging label for
the middle class segment.
i. Market Research: Emphasis on intelegent marketing activities to observe the
movements of competitors, and conducting opinion polls about consumer
perceptions of soy products brand X.
6. Programme of Action. Contains details of each element of the marketing strategy
that had been developed, primarily to respond to what will be done, when, who is
doing, and at what cost?.
7. Profit Loss Projection. Prepare budgets and profit and loss projection of a
marketing plan that will be done.
8. Control. Formulate a plan of evaluation and periodic monitoring of the
implementation plan, so that irregularities in the implementation of controls can
be done immediately.
Read More..
10:30 PM
Insurance
EVA (Economic Value Added) is one way to assess financial performance. EVA is an indicator of the existence of a value adding investment. EVA indicates that the management company managed to increase corporate value for the owners of the company in accordance with the objectives of financial management to maximize firm value.
EVA term popularized by Stern Stewart Management Service, which consulting firms in the United States around the year 90's. Stern Stewart EVA calculates by subtracting the operating profit after tax for a total cost of capital. EVA can be formulated as follows:
EVA = EBIT – Taxes - Cost of Capital
EVA can be improved with:
1. Gain more profit without using more capital, how is cutting costs, working with production and marketing costs are
lower in order to obtain higher profit margins. This can also be achieved by increasing the velocity of assets, either
by increasing the volume of asset sales or working with a lower (lower asset).
2. Getting a refund (return) is higher than the cost of capital for new investment. This is actually related to the
company's growth.
EVA Indicators:
When EVA> 0, the process added value companies, the financial performance of both companies.
When EVA = 0, shows the company break-even position
When EVA <0, means the total cost of capital is greater than the operating profit after tax earned, so the company's financial performance is not good.
Shows the amount of total capital cost of the requested compensation or refund investors on capital invested in companies. The amount of compensation depends on the level of risk the company concerned, with the assumption that the investor is risk avoidance, the higher the risk the higher the returns that investors demanded.
Capital consists of own capital (equity) is derived from its shareholders, and debt from the creditors or bondholders of the company. Level has been determined brdasarkan capital cost weighted average (weighted average cost of capital) from its own capital cost (cost of equity) and cost of debt after taxes in accordance with the proportion of equity and debt in corporate capital structure.
Read More..
10:05 PM
Insurance
Spyros Makridakis, a Frenchman, who once had a unique idea. He held a competition to spend considerable effort and involves many people. As an expert in statistics, particularly in terms of forecasting, it is easy to guess that the degree of competition that he has something to do with forecasting. In short, this Mr. Makridakis interested in testing the efficacy of the forecasting methods that have been formulated and popularized by the statisticians, both the simplest and the already very complex. No half-hearted, more than 10 forecasting methods and a number of 1001 series included data taken from various parts of the world are used as testing materials and many experts forecasting of the Americas, Europe and Australia asked for assistance as a juror in the competition this long and melted.
Many interesting conclusions and implications for practitioners from the competition. What makes the manager a little "shock" with the first result is that sophisticated forecasting methods often do not produce better accuracy compared with the simplest method. Second, for business data or a very volatile economic and having no clear pattern, in qualitative forecasting often give better results than the quantitative forecast results.
In general, the implications of that competition also contributed to the utter death knell in quantitative forecasting methods. Managers increasingly realize that the sales data obtained from the market or the business has not followed the rules or patterns are clear. As a result, the weaker the ability of managers to do the extrapolation, although with the help of the most sophisticated methods. And this is also the beginning of the destruction of long-term planning is often sounded as important to be done by a company if you want to succeed. Let alone make a sales forecast for the next five years as usual in long-term planning, just to make a forecast one year alone, the manager has eroded confidence as to the accuracy of forecasts made.
Current market conditions, both for industrial products and consumer products are too complex. Too many factors of the business environment affecting the market, ranging from government regulation, technological changes, the impact of globalization and the increasingly high level of competition. Since the beginning of the 90s decade, it is so obvious that the changes that occur sometimes no longer incremental but also contains a surprising element.
Government regulations floater, making Indonesian managers often complain especially in terms of forecasting. Changes in import duties or changes in terms of exports and imports can change the map of competitive market conditions and changes within a month. Can imagine what happens when a government such as destroying all forms of protection in the automotive sector?
Then, was it necessary to do the forecasting manager? Making forecasts of course are still needed because of forecasts remains a part of strategic planning is vital, although the drafting process becomes more difficult and its accuracy is questionable.
The result of observation, with managers at several companies showed that manufacturing activity is part of forecasting is always important for managers, especially marketing manager. Marketing Managers in general still enjoy using the percentage of forecast sales to determine how much money must be spent for promotional activities. Therefore, the making of forecasts is the initial step of creating a marketing plan. Similarly, the accounting manager, still rely on in making their budget forecasts. Even for the sales, the performance of a branch head is sometimes measured by their ability to make forecasts and bonuses from the salesman often associated with the achievement of sales compared to forecast.
Accuracy of forecasts for several types of industries is very valuable. The ability to improve the accuracy of one percent of sales can increase or reduce inventory costs in large numbers. Imagine for example by companies such as United Tractors to market their brand of Komatsu heavy equipment. Each unit of heavy equipment may be worth more than one billion rupiah. Forecast is too small will hurt the company because the company failed to make delivery at a set time so that customers may decide to purchase another product. Similarly, the forecast is very excessive inventories will provide the cost burden is very large. Therefore, the caliber company United Tractors, making forecasting is considered as a serious job.
The conclusion of the arguments and examples above indicate that creating more and more difficult to forecast but the forecast remains to be done. Below, is beebrapa things that can be used by managers as inputs in the manufacture of forecasting.
First, managers should realize the level of complexity of a market. Know the customers well and learn all the variables that affect a forecast must be an important agenda for managers. The failure of the Ford "Edsel" that often made the wrong publication is forecast to calculate the potential of the market. Companies in Detroit blame because they did not conduct a survey to determine consumer preferences, but they launched the car in accordance with what they want. Know the customers, competitors and business environment well is a good step in making a forecast. Marketing surveys should be performed routinely.
Second, managers wrestle for products that are very sensitive to changes in business environment, forecasting methods quantitative methods should be aware of. Precisely in this case, qualitative forecasting and the use of intuition of the manager in question no doubt is the way that can not be avoided anymore. To sharpen the intuition of managers, Ansoff remind managers to become more sensitive to what he calls a weak signal, which is an early symptom of a change. Only managers who listened to the voice of the consumer and have good communications with their subordinate departments or who can train their sensibilities.
Third, the sensitivity of a manager can be enhanced by improving the company's information systems. The method is called "environmental scanning system" already widely used in the large companies in the U.S. for the purpose of making forecasts. In essence, environmental scanning consists of stages such as identifying the factors that affect the business, how much each factor affect the business, make a diagram showing the critical factors and finally is making a "database environment".
Environmental scanning process in this system will memakasa managers to become more sensitive to changes in business environment at an early stage. This clearly would provide benefits to companies primarily in anticipation of a very sudden change. Perhaps a good accuracy may not be achieved with the existence of environmental scanning system, but at least, the direction of the changing business environment can be predicted more accurately.
Fourth, in making any forecasts, managers need to consider the usage scenario. The scenario is a word that has often spoken every day. Only, few managers are formally made as part of strategic planning. In these scenarios, managers realized that the capabilities are very limited in making forecasts. Therefore, making the scenario shows that instead of allocating too much time to make an accurate forecast which is basically very difficult, managers are more interested to see the implications.
Read More..
9:57 PM
Insurance
UNDERSTANDING
Cash flow (cash flow) is "a number of cash coming out and as a result of corporate activity, in other words is the cash flow of the inflow in the company and cash flow out of the enterprise and how the balance of each period.
The main thing that should always be considered in managing the underlying cash flows is to understand clearly the functions of funds / money we have, we save or invest. In a simple function which is to be divided into three
Company in its activities require adequate funding so that operations run smoothly. Companies that lack of funds will be seeking funds to cover the difference will these funds. These funds can be obtained by entering the new capital of the company owner or in any way make loans to parties outside the company. If the company made loans to parties outside the company's debt will arise as a consequence of these loans and means the company has financial leverage. The greater the debt hence its financial leverage will also increase. Means the risk that companies will be even greater because these debts.
Financing with debt or financial leverage has three important implications, namely:
1. Obtain funds through debt makes shareholders can maintain control over the company with a limited investment.
2. Creditors look at equity or owner of the funds deposited to provide margin budgeting, so that if the shareholder gives only a small part of total financing, the risk of most existing companies on the creditors.
3. If firms earn greater returns on investment financed by borrowing funds at the interest payment of an appeal, then the owner will return on capital greater than or leveraged.
Financial levarage considered profitable if the profit on the gain is greater than the fixed costs arising from the use of debt. Financial leverage is considered harmful if the income earned is less than the fixed costs arising from the use of these debts.
The company expects to invest a maximum return from these investments. The use of debt as an additional investment to fund the company's assets is expected to increase profits which will be obtained by owners of companies rather than using only its own capital of more limited. If assets are well managed company and the maximum profit will be maximum at all, because the company's assets are used by companies for corporate operational activities which aim to generate profits.
Increased use of debt by the company it will result in the company assets also increased. With the increase in assets of the company is expected profit generated by these companies will also increase. If the company's profit increase then return on equity (ROE) will also be increased. In addition, also financial leverage also increased due to greater use of debt by the company. Return on equty (ROE) is the return to equity shareholders by the measure of profit earned on its book value. This is very important concerns to investors and the creditors as a basis for a decision. If you want to invest in a company's investors or potential investors need information about the company's ability to generate profits in view of the retun received by investors and see how the company is managing its assets. The management company that does financial leverage would be viewed by investors and potential investors in managing these funds. If these funds can be managed well it will be able to increase profits is obtained and the mean return that is produced will also rise. This will be viewed well by the lenders to determine policy in distributing the funds.
Besides return on equity (ROE), earnings also have an impact on earnings per share (EPS), ie when its profits go up then the earnings per share (EPS) will also rise. Earning per share (EPS) is the result which was obtained shareholders for each share outstanding. Earning per share (EPS) is of interest to the prospective investors for the prospective investors can find out how much profit can be gained over the ownership of shares in that company. The company's management uses financial leverage in order to increase profits , with increasing the earning per share earnings (EPS) will also rise. If the management can properly manage its financial leverage to achieve the expected level of income so that the return earned per share to be increased then it will become a material for making the decision for potential investors willing to invest in these companies.
From the above explanation, it can be taken with the conclusion that the financial leverage and financial leverage ROE have a relationship with the EPS. Increased use of debt undertaken by the company resulted in the total assets of the company to be increased. Corporate assets used by the company for its operating costs with the aim of generating profits. So with the increase in expected profit company assets generated by these companies will also increase. With increased profits mean return or return on equity (ROE) will also be increased, besides it also financial leverage also increased due to greater use of debt undertaken by the company. Conversely, if the use made by the company's debt, the total assets of the company fell into fall. With decreasing the company's assets, the profit generated by these companies will also decrease. With decreasing profits mean return or return on equity (ROE) will also decrease, beside financial leverage is also decreasing because of declining use of debt undertaken by the company.
EPS as well as the ROE, which is when the use of debt undertaken by the company increased the total assets of the company resulted in a rise. Corporate assets used by companies for corporate operational activities which aim to generate profits. And with the increase in assets of the company expected profit generated by these companies will also increase. With the increase in profits means earnings per share (EPS) will also be increased, besides it also financial leverage also increased due to greater use of debt undertaken by the company. Conversely, if the use of debt undertaken by the company dropped the company's total assets decrease. By decreasing the company's assets, the profit generated by these companies will also decrease. With declining profits means earnings per share (EPS) will also decrease, beside financial leverage is also decreasing because of declining use of debt undertaken by the company.
Read More..
9:26 PM
Insurance
UNDERSTANDING
Cash flow (cash flow) is "a number of cash coming out and as a result of corporate activity, in other words is the cash flow of the inflow in the company and cash flow out of the enterprise and how the balance of each period.
The main thing that should always be considered in managing the underlying cash flows is to understand clearly the functions of funds / money we have, we save or invest. In a simple function which is to be divided into three.
First, the function of liquidity, ie the available funds for the purpose of fulfilling their daily needs and may be withdrawn in a relatively short time without any reduction in initial investment.
Second, the function of anti-inflation, the funds held in order to avoid the risk of decline in purchasing power in the future that could be withdrawn relatively quickly.
Third, growth capital, the funds destined for the addition / development of property with a relatively long period of time.
Cash flow associated with a project can be divided into three groups:
a) Initial cash flow (Initial Cash Flow) is the cash flow associated with the
expenditure for investing activities for example; purchase of land, buildings,
etc. preliminary costs. Initial cash flow can be said of cash flow out (cash out
flow).
b) Operational cash flow (operational cash flow) is the cash flow associated with
the operation of such projects; sales, general expenses, and administration.
Therefore, the operational cash flow is cash flow (cash flow) and the flow of
cash out (cash out flow).
c) Final cash flow (Cash Flow Terminal) is a cash flow associated with the project
residual value (residual value) as the remaining working capital, the residual
value of the project that is the sale of project equipment.
LIMITATIONS
Cash flow has several limitations, among others;
a) The composition of revenues and expenditures are included in cash flow which is
cash only.
b) The Company is based only on targets that may be less flexible.
c) If there is a change in internal and external situation of the company that may
affect the estimation of incoming and outgoing cash flows that should be
considered, it will be hampered by the manager will only focus on cash budget ie
the less stable economic conditions, delays in fulfilling customer kewajibanya.
BENEFITS
As for usefulness in developing the company's estimated cash flow is very useful for some parties, especially Management. Among them:
1) Provide all plans related to cash receipts the company's financial plans and
transactions that led to changes in cash.
2) Some of the basis for assessing the funding needs for the future and estimate the
repayment period.
3) Helping menager for financial policy decisions.
4) To creditors can view the company's ability to repay loans granted him.
PREPARATION STEPS
There are four rare in the preparation of cash flow, namely:
1. Determining the minimum cash.
2. Prepare revenue and expenditure estimates.
3. Prepare estimates of debt funding requirements required to cover cash deficit and
pay back the loan from a third party.
4. Reconstructing the whole receipt and expenditure after the introduction of financial transactions, and cash budget is final.
Read More..
9:06 PM
Insurance
Break event point is a situation where in an operating company does not make a profit or loss / break-even (income = total cost).
BEP is very important if we are making efforts so that we do not experience a loss, what a service or manufacturing businesses, among the benefits of the BEP is :
1. Planning tool to generate income
2. Provide information about the various levels of sales volume, and its relationship to the possibility of making profit by selling the relevant level.
3. Evaluating the company's overall profit
4. Changing the system of thick reports with graphs are easy to read and understand
Now that we know how beneficial the BEP in a business that we pioneered, kompenen a role here is cost, where cost is the cost of variable and fixed costs, which in practice to separate or define a variable cost or fixed cost was not an easy task, Costs remains is the cost incurred by us to produce or not, while variable costs are costs incurred to produce one unit of production so if not then there is no production of these costs
One of the weaknesses of other BEP is that there is only one kind of goods produced or sold. If more than one kind of the combination or composition of sales (sales mix) will remain constant. If today's views on that company to increase their competitiveness to create a lot of finished product is very difficult and there is one more assumption. The selling price of goods is unity will not change no matter how many units of the goods sold or no change in price in general. It is thus too difficult to find in reality and practice.
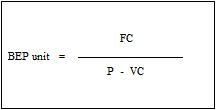
How is it calculated?
To calculate the BEP we can count in the form of units or the price depending to the needs
BEP CALCULATIONS
On the basis of unit
On the basis of sales in rupiah
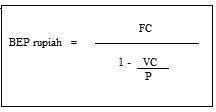
Description:
FC : Fixed Costs
P : The sale price per unit
VC : Variable Cost per unit
Fixed costs are the total costs will not be amended if there is a change in production volume. Fixed costs in total will always be constant until the level of full capacity. Fixed costs are costs that will always happen even if the company does not produce.
Variable cost is the total cost of which varies depending on the change in volume of sales / production. Variable costs will change proportionally with changes in production volume.
Read More..


